


Project management is a multifaceted discipline that involves planning, executing, and controlling projects to achieve specific goals. In the quest for efficient project management, various tools and methodologies have been developed to assist project managers in navigating the complexities of their tasks. One such tool that holds significant importance is the S-Curve. In this comprehensive guide, we will delve into the depths of the S-Curve, exploring its definition, applications, benefits, and how it serves as an invaluable asset in the realm of project management.
Defining the S-Curve
 According to information from wrike.com, In the realm of project management, an S-curve represents a mathematical chart illustrating cumulative project data, such as costs or man-hours, plotted over time. The term "S-curve" is derived from the characteristic shape of the graph, usually resembling a gentle, shallow "S." (However, it's important to note that the specific shape may vary depending on the nature of the project, allowing for alternative formations). The primary purpose of employing an S-curve in project management is to monitor the advancement of a project. In today's dynamic business environment, ensuring that a project stays within its designated schedule and budget is crucial for achieving success.
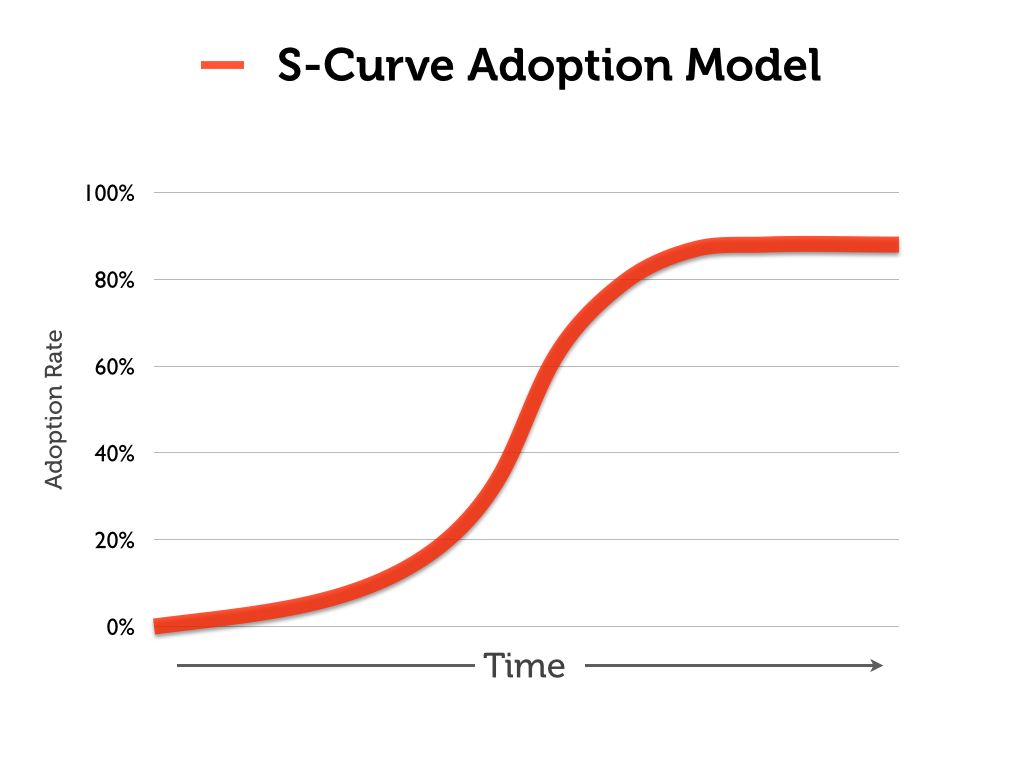
The S-Curve, also known as the sigmoid curve, is a graphical representation that illustrates the cumulative progress of a project over time. The curve's distinctive shape resembles the letter "S," hence its name. It typically tracks the growth, performance, or cost of a project in relation to time. Understanding the nuances of the S-Curve requires recognizing its key components:
1. Initiation Phase (Slow Start): At the beginning of a project, progress is often slow as resources are mobilized, plans are put in place, and initial tasks are undertaken.
2. Acceleration Phase (Rapid Growth): As the project gains momentum, the rate of progress increases significantly. This phase is characterized by a steeper incline on the S-Curve as major tasks are completed.
3. Maturation Phase (Slower Growth): After reaching its peak, the S-Curve levels off, indicating that the project is approaching completion. The remaining tasks are typically fine-tuning, testing, and any necessary adjustments.
Understanding the S-Curve's shape is crucial for project managers as it provides a visual representation of the project's trajectory, helping them make informed decisions throughout its lifecycle.
According to information from wrike.com, In the realm of project management, an S-curve represents a mathematical chart illustrating cumulative project data, such as costs or man-hours, plotted over time. The term "S-curve" is derived from the characteristic shape of the graph, usually resembling a gentle, shallow "S." (However, it's important to note that the specific shape may vary depending on the nature of the project, allowing for alternative formations). The primary purpose of employing an S-curve in project management is to monitor the advancement of a project. In today's dynamic business environment, ensuring that a project stays within its designated schedule and budget is crucial for achieving success.
The S-Curve, also known as the sigmoid curve, is a graphical representation that illustrates the cumulative progress of a project over time. The curve's distinctive shape resembles the letter "S," hence its name. It typically tracks the growth, performance, or cost of a project in relation to time. Understanding the nuances of the S-Curve requires recognizing its key components:
1. Initiation Phase (Slow Start): At the beginning of a project, progress is often slow as resources are mobilized, plans are put in place, and initial tasks are undertaken.
2. Acceleration Phase (Rapid Growth): As the project gains momentum, the rate of progress increases significantly. This phase is characterized by a steeper incline on the S-Curve as major tasks are completed.
3. Maturation Phase (Slower Growth): After reaching its peak, the S-Curve levels off, indicating that the project is approaching completion. The remaining tasks are typically fine-tuning, testing, and any necessary adjustments.
Understanding the S-Curve's shape is crucial for project managers as it provides a visual representation of the project's trajectory, helping them make informed decisions throughout its lifecycle.
The Components of an S-Curve 1. Time Time is a fundamental axis on the S-Curve, representing the project's duration. It allows stakeholders to assess the project's progress at different points and facilitates the identification of critical milestones. 2. Cost Cost is a common parameter measured on the S-Curve, showcasing the financial investment associated with the project. Tracking cost over time helps in budget management and ensures that financial resources are allocated efficiently. 3. Performance/Productivity The S-Curve can also depict the performance or productivity of a project. This could be measured by completed tasks, work units, or any other relevant metric. Monitoring performance over time aids in evaluating efficiency and making adjustments as needed.
Applications of the S-Curve in Project Management
 The S-Curve finds versatile applications in various aspects of project management. Here are some key areas where it proves to be instrumental:
1. Project Planning
In the early stages of a project, project managers use the S-Curve to create a visual representation of the expected progress over time. This aids in setting realistic timelines, allocating resources efficiently, and establishing milestones.
2. Resource Allocation
Understanding the growth pattern represented by the S-Curve helps project managers allocate resources effectively. It provides insights into when resources will be in high demand, allowing for strategic planning to avoid bottlenecks or shortages.
3. Risk Management
The S-Curve serves as a powerful tool for risk management. Deviations from the expected curve can signal potential issues, allowing project managers to proactively address challenges and mitigate risks before they escalate.
4. Performance Monitoring
Regularly updating and comparing the actual project progress with the planned S-Curve enables project managers to monitor performance effectively. This analysis helps identify areas of improvement, assess the impact of changes, and make data-driven decisions.
5. Communication with Stakeholders
The S-Curve is a valuable communication tool when engaging with stakeholders. Its visual nature simplifies complex project data, making it accessible to a broader audience. Stakeholders can easily grasp the project's status and trajectory, fostering transparent communication.
6. Benchmarking
Project managers use historical S-Curve data as benchmarks for future projects. Analyzing the performance of past projects helps in setting realistic expectations, improving planning accuracy, and enhancing overall project management capabilities.
The S-Curve finds versatile applications in various aspects of project management. Here are some key areas where it proves to be instrumental:
1. Project Planning
In the early stages of a project, project managers use the S-Curve to create a visual representation of the expected progress over time. This aids in setting realistic timelines, allocating resources efficiently, and establishing milestones.
2. Resource Allocation
Understanding the growth pattern represented by the S-Curve helps project managers allocate resources effectively. It provides insights into when resources will be in high demand, allowing for strategic planning to avoid bottlenecks or shortages.
3. Risk Management
The S-Curve serves as a powerful tool for risk management. Deviations from the expected curve can signal potential issues, allowing project managers to proactively address challenges and mitigate risks before they escalate.
4. Performance Monitoring
Regularly updating and comparing the actual project progress with the planned S-Curve enables project managers to monitor performance effectively. This analysis helps identify areas of improvement, assess the impact of changes, and make data-driven decisions.
5. Communication with Stakeholders
The S-Curve is a valuable communication tool when engaging with stakeholders. Its visual nature simplifies complex project data, making it accessible to a broader audience. Stakeholders can easily grasp the project's status and trajectory, fostering transparent communication.
6. Benchmarking
Project managers use historical S-Curve data as benchmarks for future projects. Analyzing the performance of past projects helps in setting realistic expectations, improving planning accuracy, and enhancing overall project management capabilities.
Benefits of Using the S-Curve in Project Management 1. Visual Representation: The S-Curve provides a visually intuitive representation of a project's progress, making it easier for stakeholders at all levels to understand and interpret. 2. Early Issue Detection: Deviations from the expected S-Curve can serve as early warning signs, allowing project managers to address issues before they escalate, thus minimizing the impact on the project timeline and budget. 3. Strategic Decision-Making: Understanding the growth phases of a project through the S-Curve enables project managers to make strategic decisions regarding resource allocation, risk mitigation, and overall project planning. 4. Improved Communication: The graphical nature of the S-Curve facilitates effective communication with stakeholders. Complex project data can be presented in a clear and concise manner, fostering better understanding and collaboration. 5. Resource Optimization: By aligning resource allocation with the S-Curve's projected demands, project managers can optimize the utilization of resources, preventing bottlenecks and ensuring a smooth workflow. 6. Performance Analysis: Regularly comparing the actual project performance with the S-Curve allows for in-depth performance analysis. This analysis guides continuous improvement efforts and contributes to enhanced project management practices.
Implementing the S-Curve in Project Management 1. Data Collection and Analysis To create an S-Curve, project managers need accurate and up-to-date data on project progress, costs, or performance. This data is then analyzed to identify trends and predict future project trajectories. 2. Software Tools Several project management software tools include features that automatically generate S-Curves based on input data. These tools simplify the process of creating, updating, and analyzing S-Curves, saving time and reducing the likelihood of errors. 3. Regular Updates and Monitoring The S-Curve is a dynamic tool that requires regular updates to reflect the actual project status. Project managers should monitor progress, costs, or performance continuously and adjust the S-Curve accordingly. 4. Integration with Other Project Management Tools Integrating the S-Curve with other project management tools enhances overall project visibility. Combining it with tools such as Gantt charts, risk matrices, and resource management systems provides a comprehensive view of project dynamics.
Challenges and Limitations of the S-Curve While the S-Curve is a powerful tool, it is essential to recognize its limitations and potential challenges: 1. Assumption of Predictability: The S-Curve assumes a predictable project environment. In reality, projects may face unforeseen challenges, leading to deviations from the expected curve. 2. Dependence on Accurate Data: The accuracy of the S-Curve is heavily dependent on the accuracy of the data used to create it. Inaccurate or outdated data can result in misleading projections. 3. Limited Scope: The S-Curve primarily focuses on time, cost, or performance. It may not capture all aspects of project complexity, such as stakeholder dynamics, organizational changes, or external factors. 4. Resistance to Change: Stakeholders may resist changes to the S-Curve, especially if it indicates delays or increased costs. Effective communication is crucial to managing expectations and garnering support for necessary adjustments.
Real-world Examples of S-Curve Application
 1. Construction Projects
In construction, the S-Curve is frequently used to monitor the progress of building projects. It helps in predicting the time and cost required for completing various construction phases, enabling effective project management.
2. Information Technology (IT) Projects
IT projects, including software development, often involve complex timelines and resource allocation. The S-Curve aids in visualizing and managing the project's evolution, ensuring that it aligns with the initial planning.
3. Product Development
For product development initiatives, the S-Curve assists in tracking the performance of teams, predicting resource needs, and identifying potential roadblocks in the development process.
4. Infrastructure Projects
Large-scale infrastructure projects, such as the construction of bridges or highways, benefit from the S-Curve by providing a comprehensive overview of the project's lifecycle and aiding in strategic decision-making.
1. Construction Projects
In construction, the S-Curve is frequently used to monitor the progress of building projects. It helps in predicting the time and cost required for completing various construction phases, enabling effective project management.
2. Information Technology (IT) Projects
IT projects, including software development, often involve complex timelines and resource allocation. The S-Curve aids in visualizing and managing the project's evolution, ensuring that it aligns with the initial planning.
3. Product Development
For product development initiatives, the S-Curve assists in tracking the performance of teams, predicting resource needs, and identifying potential roadblocks in the development process.
4. Infrastructure Projects
Large-scale infrastructure projects, such as the construction of bridges or highways, benefit from the S-Curve by providing a comprehensive overview of the project's lifecycle and aiding in strategic decision-making.
Conclusion The S-Curve stands as a cornerstone in the realm of project management, offering a dynamic and visual representation of a project's journey over time. Its applications extend across industries and project types, providing valuable insights that aid in effective planning, resource allocation, risk management, and communication with stakeholders. While the S-Curve is not without its challenges and limitations, its benefits in enhancing project visibility and facilitating strategic decision-making are undeniable. As project management continues to evolve, the S-Curve remains a timeless tool, guiding project managers towards successful project delivery. Now, you no longer need to worry about creating an S Curve to manage your project, as all of it can be accessed through Tomps Project. By utilizing Tomps Project, you can easily monitor and plan your project using its various advanced features. Don't delay any longer! Start using Tomps Project now to enhance the efficiency of your project management!
Reference Apa Kurva S dalam Manajemen Proyek?. wrike.com. https://www.wrike.com/project-management-guide/faq/what-is-the-s-curve-in-project-management/